Matched Market Test: validating offline media campaign impact
This case frames an offline media measurement problem for TV/OOH campaigns where user-level tracking is not practical. The measurement question is whether treated markets generated more foot traffic than similar untreated markets would have predicted without the campaign.
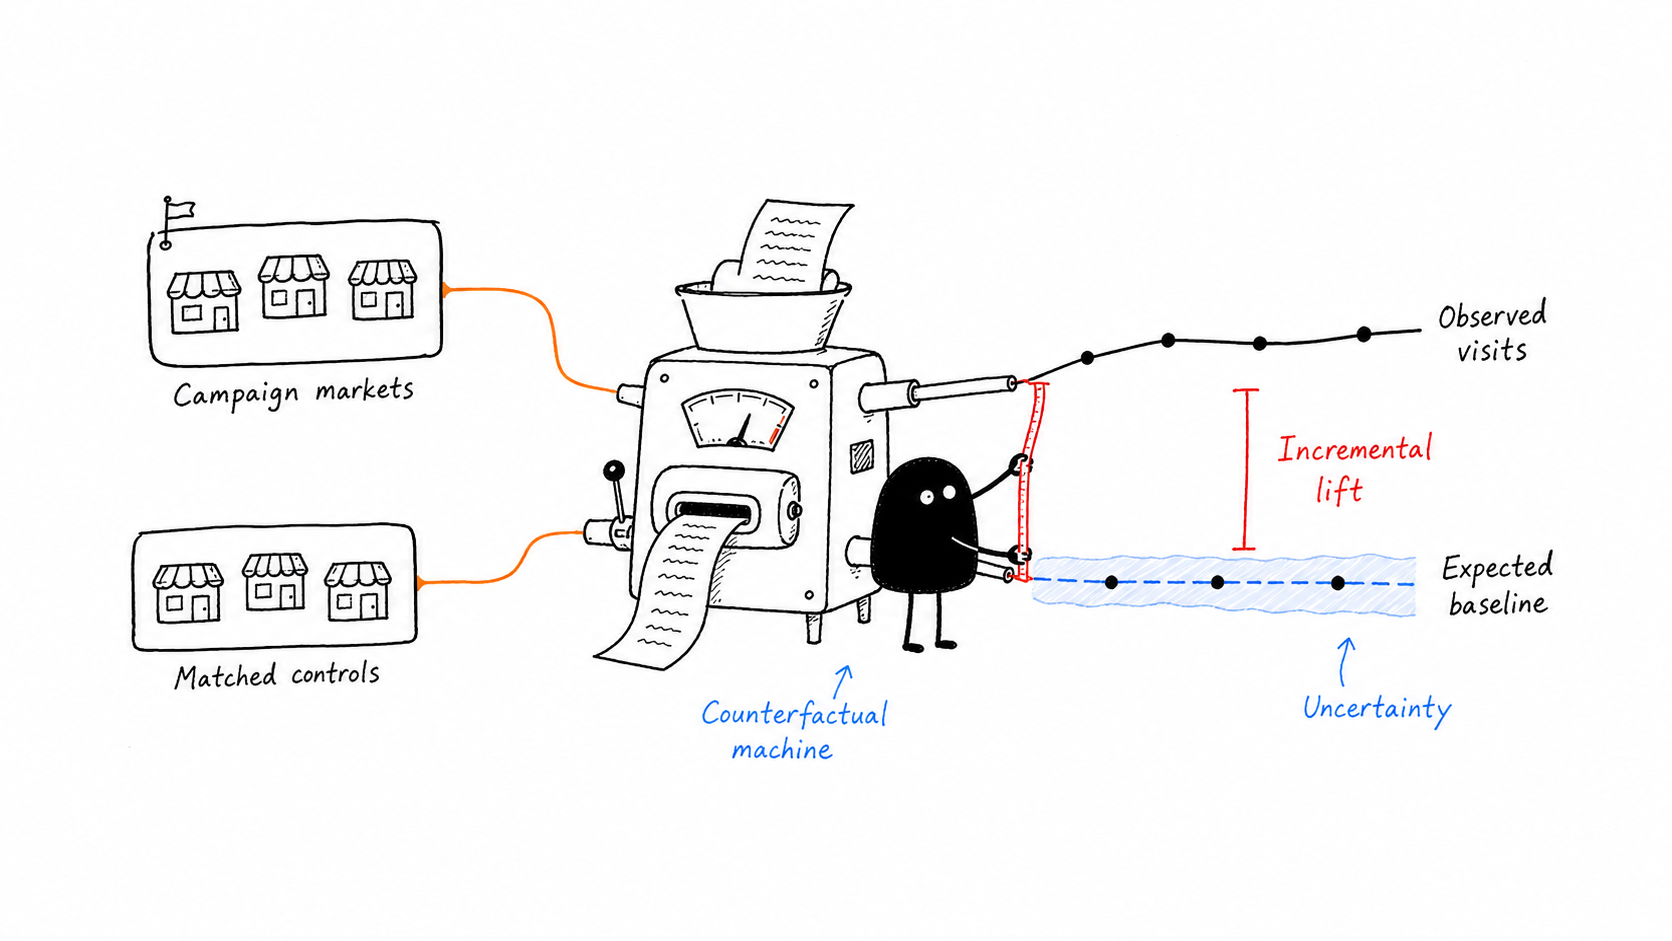
- Situation / TaskTV/OOH campaigns are hard to evaluate at the user level, so the business needed a market-level way to validate whether offline media created incremental foot traffic.
- ActionI matched test markets to control markets using pre-campaign foot-traffic patterns, market size, media delivery, and spillover risk, then used R + CausalImpact to estimate the no-campaign counterfactual baseline.
- ResultThe analysis produced an impact-validation readout: actual timestamped foot traffic versus the predicted no-campaign path, with lift, uncertainty, and the key data-source limitation clearly separated.
- Statistical theory estimate the missing no-campaign path by combining trend, if needed, and control-market predictors, then return a for lift.
- LimitationThe main constraint was data source quality: offline timestamped foot traffic was available, but online store-visit or richer conversion data would have improved validation.
- Non-technical communicationCompare campaign markets with similar non-campaign markets so we can estimate what foot traffic would have looked like without TV/OOH exposure.
How I find matched controls
I would use as an initial screen, but not as the only matching criterion. I first index or normalize the outcome, then look for markets with similar trend, seasonality, and business characteristics.
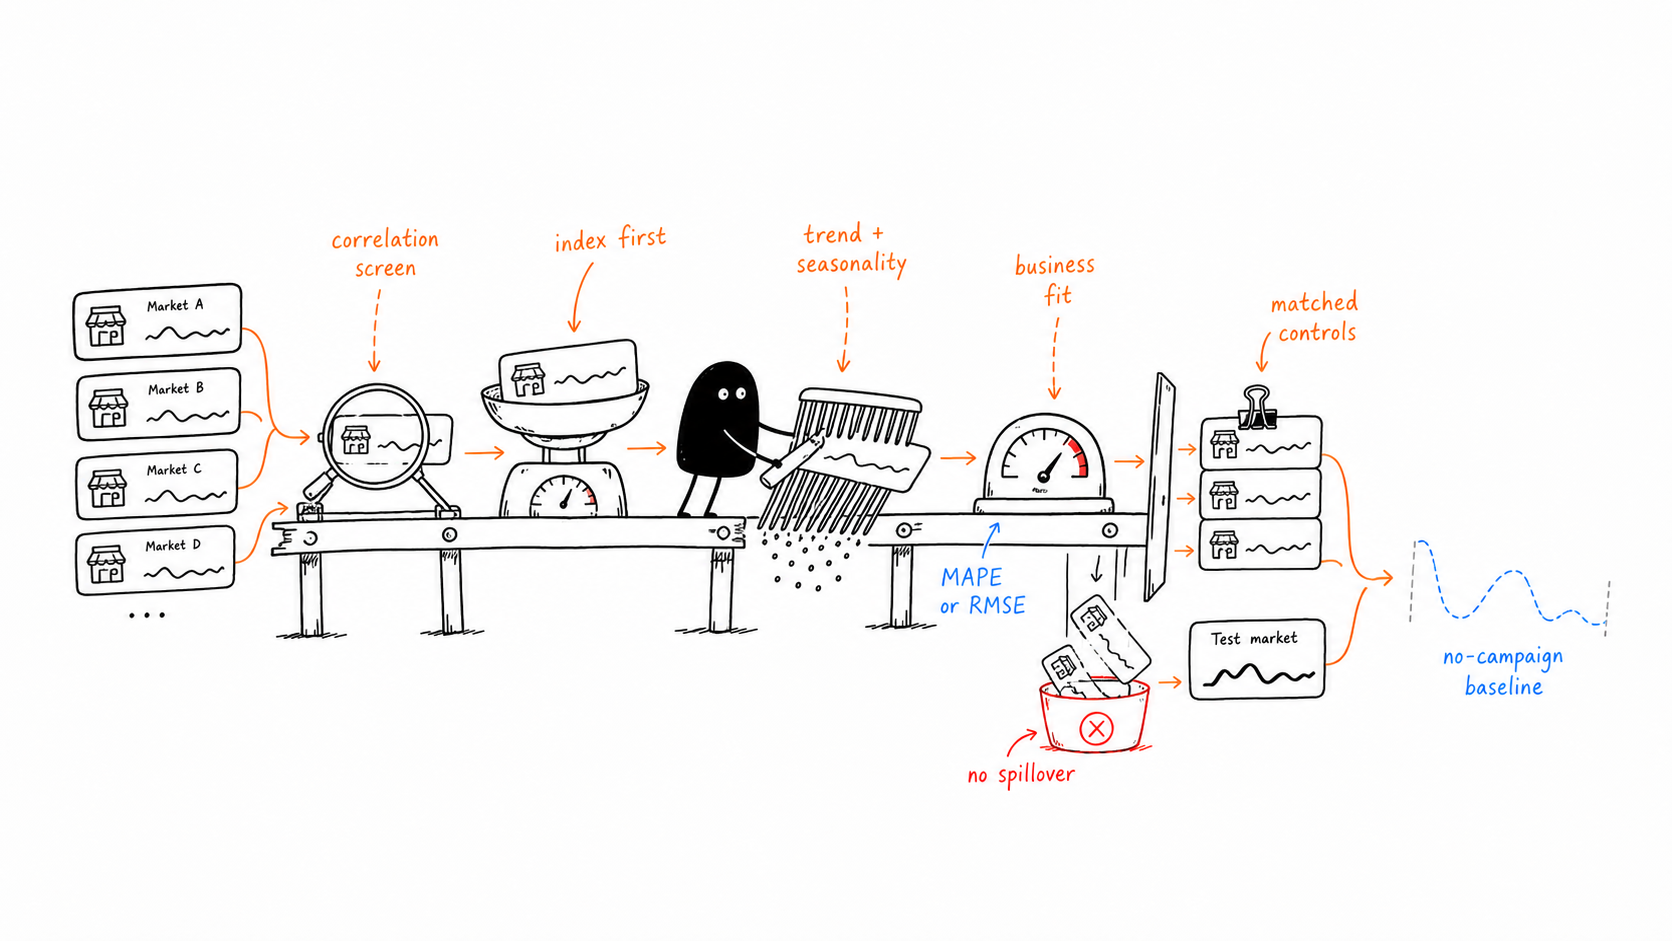
- 01 / NormalizeIndex pre-period visits or sales so market size does not dominate the match. Correlation is useful here, but only as the first screen.
- 02 / QualifyCheck trend, seasonality, market size, business context, media delivery, and spillover risk before calling a market a viable control.
- 03 / PredictBuild a pre-period prediction model or , then evaluate fit with or .
- 04 / ProtectExclude controls that were exposed to the campaign, influenced by nearby treated markets, or affected by the same operational shock.
- 05 / CompareIn the post-period, compare actual test-market performance against the predicted .
- 06 / DecideTranslate the gap between actual and predicted outcomes into , uncertainty, and a business recommendation.
How I create a synthetic control
For a marketing campaign example, imagine an ice cream brand runs offline media in Ohio. Sometimes the historical data cannot find a single state that behaves exactly like Ohio before the campaign. Instead of forcing a weak one-to-one match, I mix several control states with different weights, almost like blending colors, until the synthetic market recreates Ohio's pre-campaign trend as closely as possible.
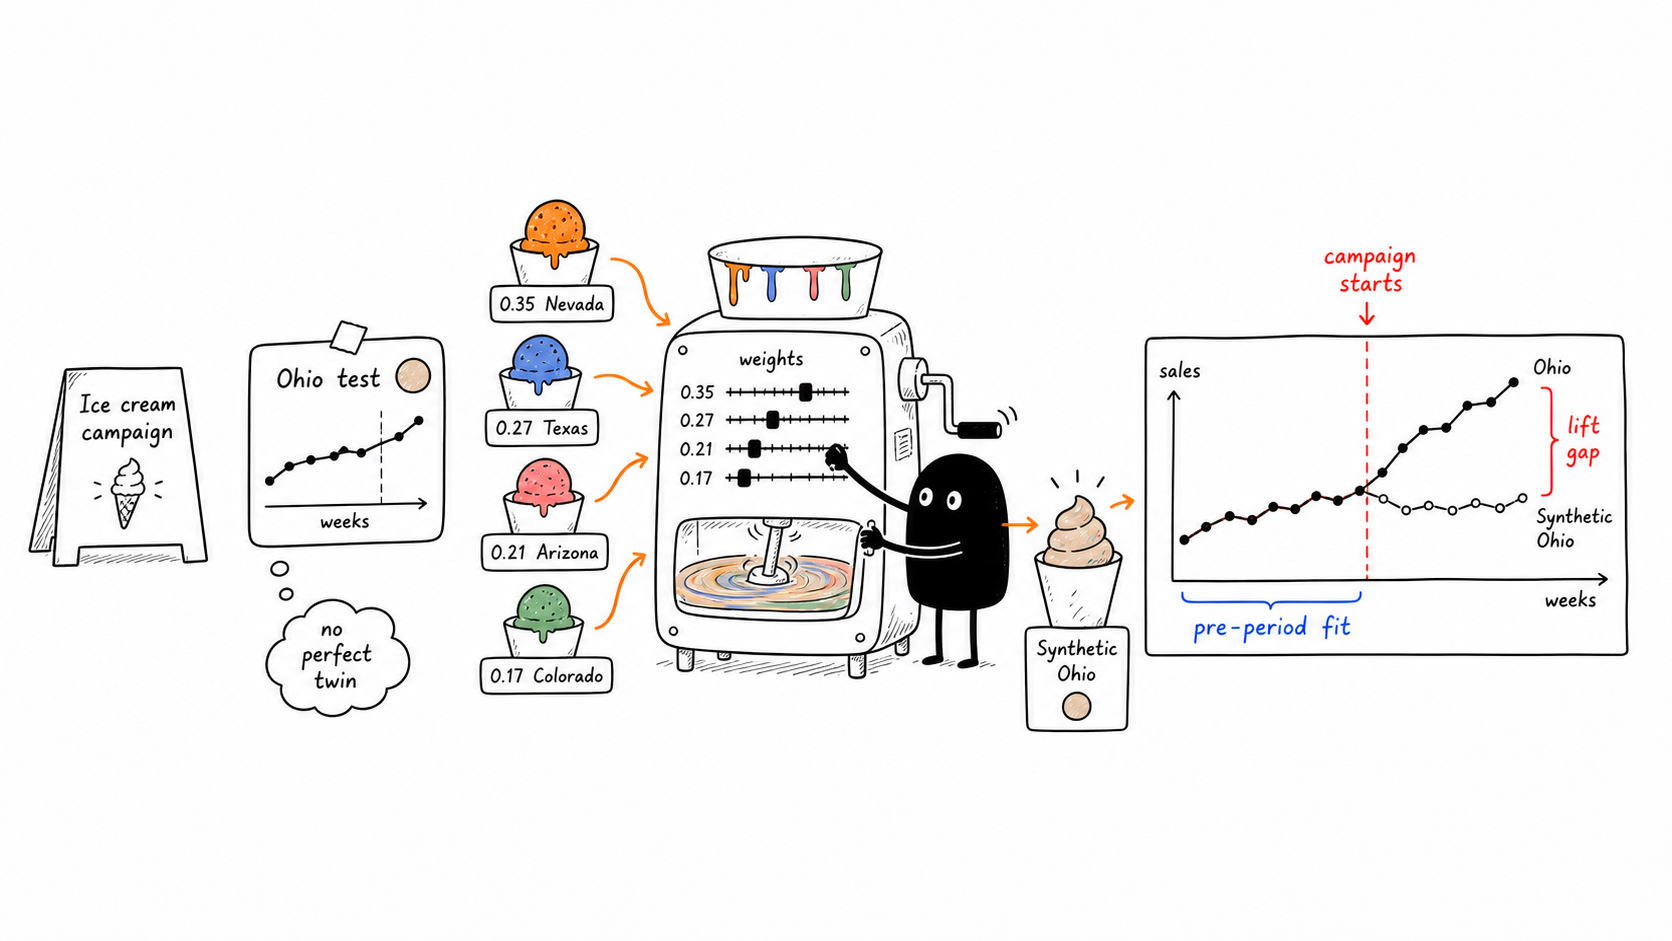
- 01 / Define OhioOhio is the treated market where the ice cream campaign runs. The outcome is market-level sales or visits over time.
- 02 / Build the donor poolScreen potential control states that were not exposed to the campaign and do not have major spillover risk.
- 03 / Optimize weightsCreate Synthetic Ohio from weighted controls: 0.35 Nevada, 0.27 Texas, 0.21 Arizona, and 0.17 Colorado.
- 04 / Validate pre-fitThe weighted control blend must closely track Ohio during the . If the pre-period fit is weak, the post-period lift readout is not credible.
- 05 / Compare after launchAfter the campaign starts, compare actual Ohio against Synthetic Ohio, which acts as the no-campaign .
- 06 / Translate liftIf Ohio sales rise while Synthetic Ohio does not, the gap is evidence that the campaign created .
library(CausalImpact)

# Synthetic schema:
# date, market_id, visits, treatment_market, campaign_active

impact_data <- data.frame(
  y = treated_market$visits,
  control_1 = control_market_1$visits,
  control_2 = control_market_2$visits,
  control_3 = control_market_3$visits
)

pre.period <- c(1, 84)
post.period <- c(85, 112)

impact <- CausalImpact(
  impact_data,
  pre.period,
  post.period,
  model.args = list(nseasons = 7)
)

summary(impact)
summary(impact, "report")- InputTimestamped offline foot traffic, treatment-market flag, candidate control markets, and campaign start/end dates.
- DiagnosticPre-period actual versus predicted fit, plus MAPE/RMSE, to decide whether controls can credibly predict the test market.
- ReadoutObserved visits versus predicted no-campaign baseline, incremental lift, uncertainty interval, and limitation notes.
- DecisionValidate impact when lift is credible; scale cautiously or improve outcome data when uncertainty or data coverage is weak.